The subject of how many people visit this site came up yesterday, so I thought it would be fun to share with you the Google Analytics findings on this subject for the calendar year of 2016.
Here is a line graph showing the number of visitors per day for the entire year, divided by quarter.

On average, the site sees around 300 visitors per day. This indicates, as is common for most social websites, that the number of lurkers outweigh the number of commenters. (This is where I’ll note that if you haven’t commented before but want to say something, don’t be shy! Sign up for a Disqus account and add your contribution!)
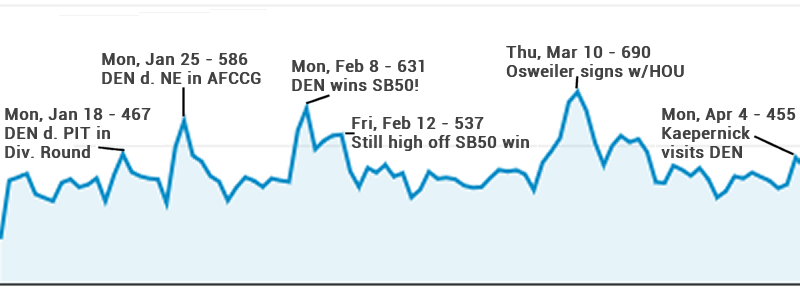
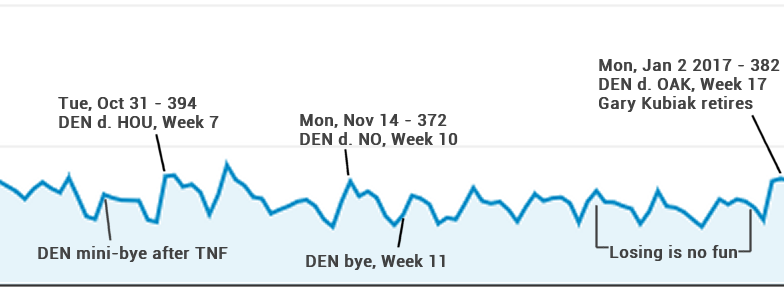
This number, that number fluctuates greatly based upon the day of the week. Monday is actually the most frequently visited day of the week, of which makes sense since most of us want to give our takes, be they scorching hot or ice cold, over what happened over the course of game day. Sundays during the regular season tend to come in second for obvious reasons. However, if the Broncos do not play on Sunday (either because they played on Thursday or were on a bye), visitors for that day and the corresponding Monday tend to be lower. Saturdays are by far the least visited, of which should also be no surprise.
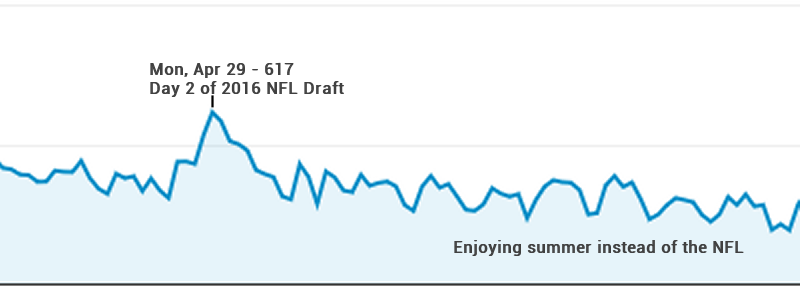
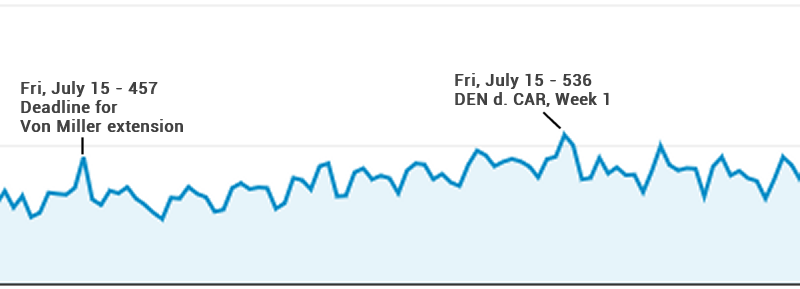
The offseason fluctuates a little less, and has fewer (but not by much) overall visitors. Two large peaks take place during the start of free agency, and during the draft. There was also a peak on a date that won’t happen every year: July 15, the deadline for franchise tagged players to agree to terms on a multi-year contract.
The following four graphs split up the entire year by quarter, and I have provided comments on the notable events that happened that caused respective notable visitor statistics.