The longtime conventional wisdom of coaches results in teams rarely going for it on 4th down. Recent analytical studies argue for going for it far more often. My own sensibilities reside somewhere in the middle of these two approaches. I certainly feel coaches are too conservative, but I also have yet to buy into some of the excesses of the other side. With this article, I want to explore the subject further by starting with some common sense observations, and then extrapolating it with some data that could be useful to build upon that common sense into a possible model. That model is what I’ll term the Go For It Range, dividing the field into areas where going for it on 4th down is advocated, opposed, or debatable. To see the Go For It Range in action, visit this page, in which I’ve programmed the model for any offense versus any defense.
The most popular 4th down analytical model out there is the 4th Down Bot from the New York Times. At the pinnacle of its aggressive approach is for teams to always go for it on 4th & 1–even if a team is pinned at its own 9 yard line.
My eye test has never fully supported this approach. The most prominent counterexample that comes to my mind is the game that NFL Network declared to be Peyton Manning’s 7th greatest game: when Bill Belichick went for it on 4th & 1 and a half from his own 28, and failed–allowing Manning to lead a short drive and score the game winning touchdown. Brian Burke, who founded the 4th Down Bot, supported Belichick’s decision, while admitting that Colts had higher odds to turn a drive into a touchdown than the league average. I think that admission needs to be explored further.
Let’s think about a drive in its basic terms. A drive will continue to last based upon one factor: whether the offense can continue to gain first downs. The more series of downs the offense has to convert, the higher the odds rise that one of those down series will result in a failed attempt to gain a first down. That failure can arise at any time from several factors attributed to bad luck or skill that can strike: a receiver drops a pass, a lineman misses a blocking assignment, a coordinator makes a poor play call, and so on. It can’t be said for sure whether that failure would happen on the first series of downs or the sixth, but the more series that a team has to convert, the odds rise that something will go wrong. Furthermore, it also makes sense to adjust these odds to take into account for what offense and defense are on the team at the time. It should go without saying that offenses would have better odds converting against the 2015 Saints than the 2015 Broncos.
Considering the above, I would consider the two following questions in order to determine whether to go for it on 4th down:
- Is the offense capable of gaining more yards against the defense, on average, than the distance of the 4th down? The answer is likely yes on 4th & 1, likely no on 4th & 10, and maybe on 4th & 5.
- If the above answer is yes, are the odds of continuing the drive into the end zone for a touchdown better than the opposition’s odds would be to score a touchdown or get into field goal range from the line of scrimmage, should the 4th down attempt fail? If yes, then go for it.
From a common sense standpoint, this strikes me as reasonable. Obviously the team needs to have the capability to gain enough yards on the 4th down to begin with. But even if you have the capability, there’s a chance the play could go wrong. Is it really wise to risk giving up a short field to the opposition, especially in the 4th Down Bot’s extreme case of going for it on 4th & 1 from the team’s own 9 yard line?
Answering question #1 is simple enough: take a look at the offense’s yards per play (YPP), adjusted against the YPP that the defense yields. If that yards per play is greater than the distance, then it’s more likely than not that the offense will be able to convert the 4th down. In 2015, the NFL average YPP was 5.45 on offense and 5.47 on defense, making its own average between the two to be 5.46. This would suggest that, absent specific team YPP or unique game circumstances, going for it should generally be limited to 4th & 5 or shorter.
The answer to question #2, the odds of a drive resulting in a touchdown or field goal, is trickier. I believe I’ve come up with a decent formula for it, but a fair warning, there is much math ahead. If you want to skip the math, scroll down to the example section.
Determining Scoring Drive Odds
I’ll go ahead and begin by spitting out the ugly formula that I think could be a good determination of the odds of a drive resulting in a score:
TD Drive Odds = AVG(ODSR,DDSR)DFG/(AVG(OYPP,DYPP) * (3+OFDAR))
FG Drive Odds = AVG(ODSR,DDSR)(DFG-(FGR-18)/(AVG(OYPP,DYPP) * (3+OFDAR))
- ODSR = Offensive Drive Success Rate
- DDSR = Defensive Drive Success Rate
- DFG = Distance From Goal
- FGR = Field Goal Range
- OYPP = Offensive Yards Per Play
- DYPP = Defensive Yards Per Play
- OFDAR = Offensive Fourth Down Attempt Rate
OK, let’s take that alphabet soup step by step.
Drive Success Rate
The always outstanding Football Outsiders has data that I feel could provide a core piece to the 4th down puzzle: Drive Success Rate. As explained, DSR “measures the percentage of down series that result in a first down or touchdown”. Even better, FO breaks this down between offense and defense, allowing the ability to pit specific offensive and defensive units against each other.
Let’s take the league’s best offensive DSR in 2015, the New Orleans Saints. They converted a series of downs 75.1% percent of the time. Without adjusting for defense, if the Saints had to convert two series of downs to score a touchdown, the odds of both series being successful would be .751 * .751 (or .7512), coming out to 56.4%. The odds are still in the Saints’ favor to finish off the drive with a touchdown. With three series of conversions required, now the odds are against the Saints, as .7513 comes out to 42.4%. The odds get worse with an increased number of series required.
Now let’s adjust for defense. If that 2015 Saints offense is going against the 2015 Bucs’ defense with a DSR of 73.6% (second worst only to the Saints’ own defense), nothing much changes, as the aggregate of the opposing DSRs is 74.35%. But if they’re going up against the 2015 Broncos, with a defensive DSR of 63.5% (second best only to the Jets), now the odds fall. With an aggregate DSR of 69.3%, the odds of the Saints converting two series of downs (.6932) falls to 48%, meaning it’s more likely than not that they’ll fail. It gets even worse with three series, at 33.2% (.6933), and so on.
The TL;DR version of this states the obvious: the longer a offense has to drive, the less likely it will be able to string together several series of downs to score a touchdown–and it gets harder against better defenses.
The next question is how to determine that exponent that you see being operated upon the average of the drive success rates: in other words, the likely number of series of downs that it will take to get to the end zone from any particular place on the field.
Expected Series of Downs
This is another place where I think yards per play (YPP) could come handy. As stated above, the league average of YPP was 5.46. Of course, plays don’t always gain 5.46 yards, otherwise every drive would be a touchdown. Some plays will go far longer than 5.46 yards, others will go for no gain or a loss.
The key question, then, is how to divide those plays into series of downs. Obviously, teams will have at least three downs to convert a series, and will sometimes go for it on 4th down as well. Thus, start with 3, and then add the 4th down attempt percentage. Leaguewide, teams tend to go for it about once every eight times, or 12.% percent of the time. (In 2015 the Dolphins went for it the most at 20.4%, and the Cardinals the least at 6.25%. The Broncos were near league average at 12.1%.)
What I’ve attempted to formulate here is the expected series of downs, the number that is to be used as the exponent in the formula above to determine the odds of a drive resulting in a touchdown from the distance away from the goal line, or the odds of entering field goal range, in which you’d subtract the kicker’s career long, less 18 yards to account for the end zone and long snap distances.
Illustrating the Go For It Range
The best way to convey the Go For It Range is to visualize it (as I’ve done here) by splitting a football into three areas, colored green, yellow, and red:
- In the green area, the offense should go for it, as the odds are less than 50% that the opposition would be able to get into field goal range (and further less to score a touchdown) should a turnover on downs occur.
- In the red area, the offense should punt, as the odds of the opposition scoring a touchdown are greater than the odds of the offense scoring a touchdown even if they don’t turn the ball over on downs.
- The yellow area indicates a range in which the odds of the offense scoring a touchdown are greater than the opposition, but the odds of the opposition getting into field goal range is greater than 50%. In the yellow area, going for it depends on whether or not the team is comfortable with giving up a potential field goal should it turn the ball over on downs.
A General Example: 2016 Texans at Broncos
The first Go For It Range charts I’ll put together will deal with this Monday night’s game. First, here’s the Broncos offense vs. the Texans defense:
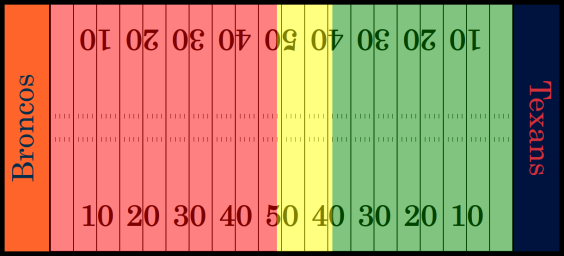
Both the Broncos offense and Texans defense average 5.1 yards per play, of which puts 4th & 5 and shorter into play. The Broncos offense is 16th in drive success rate, while the Texans defense is 9th. The Go For It Range suggests the Broncos should first consider going for it at their own 49, and commit to it beyond the Texans’ 39, so long as the distance to go is 5 yards or less.
Next, the Texans offense vs. the Broncos defense:
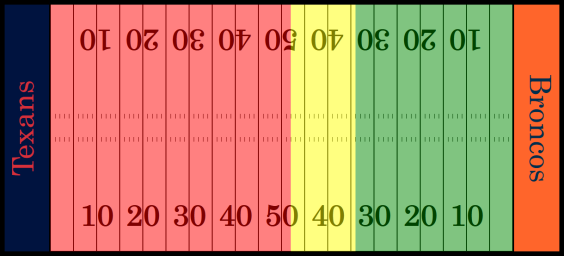
It’s a little more unfavorable for the Texans offense. To begin, it ranks 29th in drive success rate, of which should be no surprise given all the three and outs they’ve racked up. (The Broncos defense is 9th in drive success rate.) Second, the Texans offense only averages 4.9 yards per play, and the Broncos defense gives up only 4.6 yards per play. To add insult to injury, that means it takes 4th & 5 off the table for Brock Osweiler & Co. For the Texans offense, the Go For It Range advocates starting to consider it at the Broncos’ 48, with a firm commitment not coming until the Denver 34.
A Specific Example: 2015 Bengals at Broncos
This example will deal with looking at the numbers closer. The situation: losing 14-10 in the 4th quarter with 13:45 remaining, the Broncos faced a 4th & 1 from their own 24 yard line. They punted. The 4th Down Bot was apoplectic: the Broncos “definitely” should have gone for it. Given how the 2015 Broncos offense operated, how many of you would have agreed with that suggestion?
What does the Go For It Range that I’ve put forward say? Let’s start with the Drive Success Rates and Yards Per Play for both teams:
| ODSR | DDSR | OYPP | DYPP | |
| DEN | 66.2% (28th) | 63.5% (2nd) | 5.2 (26th) | 4.5 (1st) |
| CIN | 72.5% (6th) | 67.0% (10th) | 5.6 (9th) | 5.3 (9th) |
As we all know, the Broncos’ offense struggled mightily in 2015, and it was going up against a good defense in Cincinnati. Even if the Broncos were able to pick up that one yard to keep the drive going, they still had 75 more yards to go. Under the Go For It Range, the odds of the Broncos securing a touchdown drive would still be only 15.6%. A turnover on downs, however, would already put the Bengals in field goal range, and give them a 55.5% chance of getting into the end zone from a start at the Broncos’ 24.
The Go For It Range has a clear suggestion: punt the damn ball. With Britton Colquitt’s net punt distance average in 2015 being 39.7 yards, the Bengals’ odds of driving to the end zone in 64 yards (from their own 36), against the Broncos’ dominating defense, goes down to 20.9%, and the odds of getting into field goal range fall to 51.6%.
In real life, Colquitt’s punt did better than average, traveling 54 yards, and Kayvon Webster added insult to injury by tackling Brandon Tate back another 3 yards, putting the ball at the Bengals’ 19. Touchdown drive odds from there would come out to a measly 13.8%, even worse than the Broncos’ odds of getting their own drive in the end zone. Field goal range odds also fell to 34%. The Bengals went three and out, and the Broncos got the ball back at their own 48. 52 yards away, the Broncos’ touchdown drive odds now increased to 27.6%–still not good, but better.
Of course, sometimes those 27.6% chances happen–27.6% of the time, in fact–and two plays later, CJ Anderson broke free to put the Broncos ahead 17-14.
Limitations
The biggest limitation to the Go For It Range that I foresee has to deal with red zone conversion rates, as those tend to be lower than in general due to the shortened defensive backfield. Perhaps a future update to the formula could account for that properly.
There is also question as to what defines “field goal range”. Looking at this further, I was surprised at just how much of a lack of objective data there was in determining this. It has made me question the helpfulness those field goal range lines that broadcasters often superimpose over the field. This model is using the bright line of career long, but that too is flawed due to outliers. The best current example: do you really think Matt Prater can hit a 64 yarder in Detroit?
Regardless, I hope that I may be onto something with the Go For It Range. Any feedback is always appreciated. As mentioned, if you want to play around with examples for all 32 teams, visit the website here.