I thought I’d try out what might be a new series for me, taking a closer look at the most recent game and trends using Pro Football Reference’s tools to look at Snap Counts, play by play data, and historical data. Let me know what you think and if you have any feedback and I might make this a regular occurrence:
Looking at the Broncos Run Plays
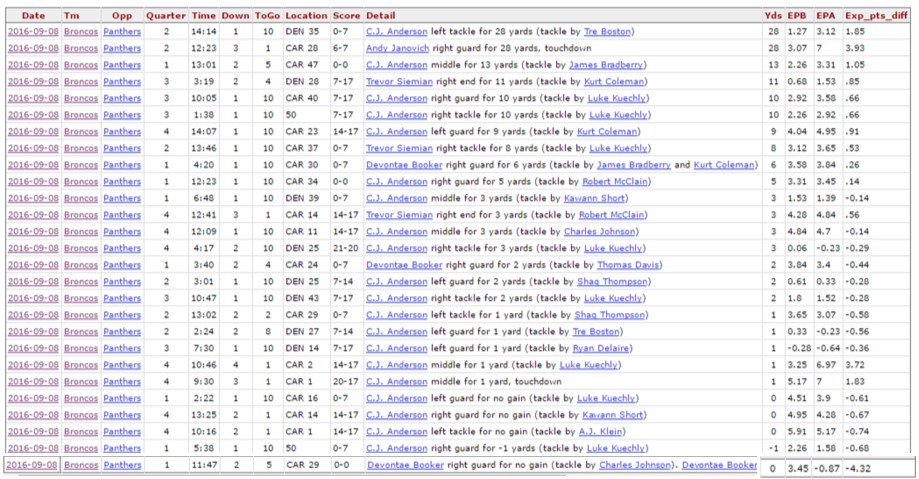
The Broncos had quite a few long runs that accounted for most of their yards. They broke off runs of 10 yards or more 6 times (22% of runs), and that accounted for 66% of their rushing yards. I’m very excited about their ability to break off big plays. On the flip side, they were stopped for 2 yards or less 12 times (44% of runs), and 1 yard or less 9 times (33% of runs). Two of those plays were successful short yardage conversions (CJ’s 3rd and 1 and 4th and 1 conversions).
Here’s a table with this summarized, along with comparisons to the 2015 Broncos team, the Panthers 2015 Panthers defense and the league average in 2015. Although not relevant, I added the 2015 Broncos D to show just how dominant they were against the Run.
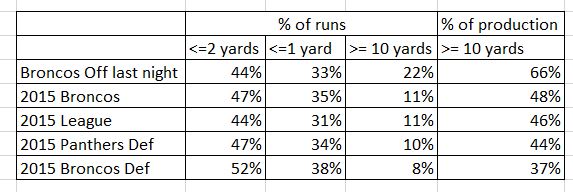
The Broncos made improvements in not being stuff compared to last year, but I think there is still work to be done if they want to have a rushing attack that can carry the offense. The Panthers did have a great (but not spectacular) rushing defense last year. All things considered, I think there should still be much optimism about the rushing attack this year.
Turnovers and wins
Much has been made about the success the Broncos had last year even while turning the ball over 31 times (fourth most in the league). I think this misrepresents what happened last year to an extent. Here is a breakdown of the Broncos roster last year based on how many turnovers they had, and how that compares to the league average.
| Turnovers | Broncos Record | League Record |
| 4+ | 1-1 | 3-35 |
| 3 | 1-0 | 17-43 |
| 2 | 3-3 | 55-67 |
| 1 | 6-0 | 82-79 |
| 0 | 1-0 | 99-32 |
Last year, the Broncos went 7-0 in games with 0 or 1 turnovers, and 3-3 in games with 2. Both of these trends match what you would expect compared to the league average. However, the Broncos managed to go 2-1 in games with 3+ turnovers. This bucks the trend of the league, and is likely due to the Broncos having two of their 3+ turnover games against some of the worst teams in the league (Cleveland and San Diego). Those games were much much closer than they should have been, but if you are going to have those types of games, might as well be when against crappy opponents.
Before Thursday’s game, this analysis from last year lead me to believe it was unrealistic to expect the Broncos to have much success (even with their defense) in multi-turnover games. But, the Broncos worked the Mile High Magic again, this time beating the defending NFC Champs despite 3 turnovers.
Regardless of this data point, I still do not believe the Broncos can win if they continue to turn the ball over. Booker (or whoever backups CJ) will need to hold onto the ball, and Siemian will have to take better care of it as well. Luck and a good defense can only get you so far.
Snap Counts
Offensive Snap Counts
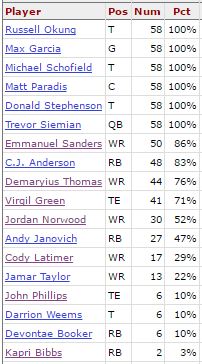
- I do not like that CJ Anderson took 83% of the snaps at RB. This is not a recipe for long term success. Is it too late to get Hillman back?
- Unlike last year, there was no rotation needed on the Oline (except for Weems coming in as the third tackle), hopefully that is a good thing.
- The “average play” saw 2.65 WR, .96 RBs, 0.81 TEs, and 0.47 FBs. I am a little surprised the Broncos used 3+ WR sets so frequently, even with Sanders and DT taking snaps up when they were banged up.
Defensive Snap Counts
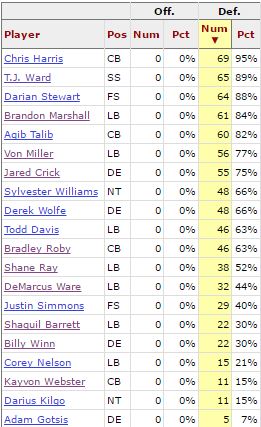
- There were a total of 73 snaps. I can never remember a game where no defensive players played all the snaps, and so few even came close. Being at the game, I’m not sure whether they rotated guys in the secondary due to injury or something else. Will be interesting to see if this continues.
- Kayvon Webster’s 11 Defensive snaps were more than in any game last year (except for KAN game where he was filling in for a suspended Talib).
- The “average play” saw 2.6 DLs, 1.5 ILBs, 2.2 OLBs, 2.2 S, and 2.5 CBs. This is nearly identical to the typical breakdown last year.
- I’m a little concerned that the rotation of the D-line wasn’t as frequent. Kilgo and Gotsis will need to see more than 16 snaps combined if we are to keep the line fresh.
- I heard talk this summer about keeping Ware on a very limited “pitch count,” with estimates ranging between 8 and 25 snaps per game. That was not the case last night as he played 32 snaps. He was incredibly productive, earning 1.5 sacks. Hopefully he can keep this up all year.
Special Teams snap counts
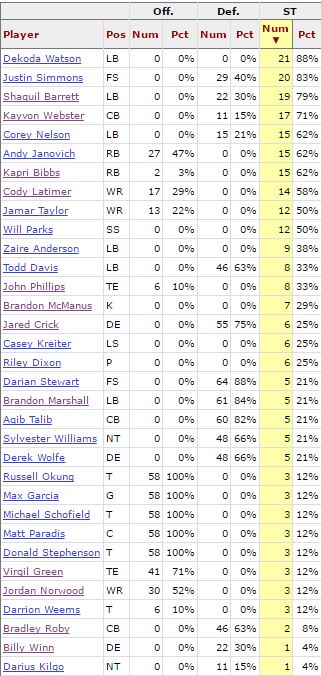
I won’t comment too much here. Looks like coaches like what Watson does on STs.
Like I said, let me know what you think of this series. I did not post links to most the Pro Football Reference data I reference, but I’d encourage you to go explore the site anyways. I’ve used the site a bunch, and have a pretty good handle on what types of information you can look up. I’d love to help anyone looking to explore, and answer any questions anyone has about PFR.